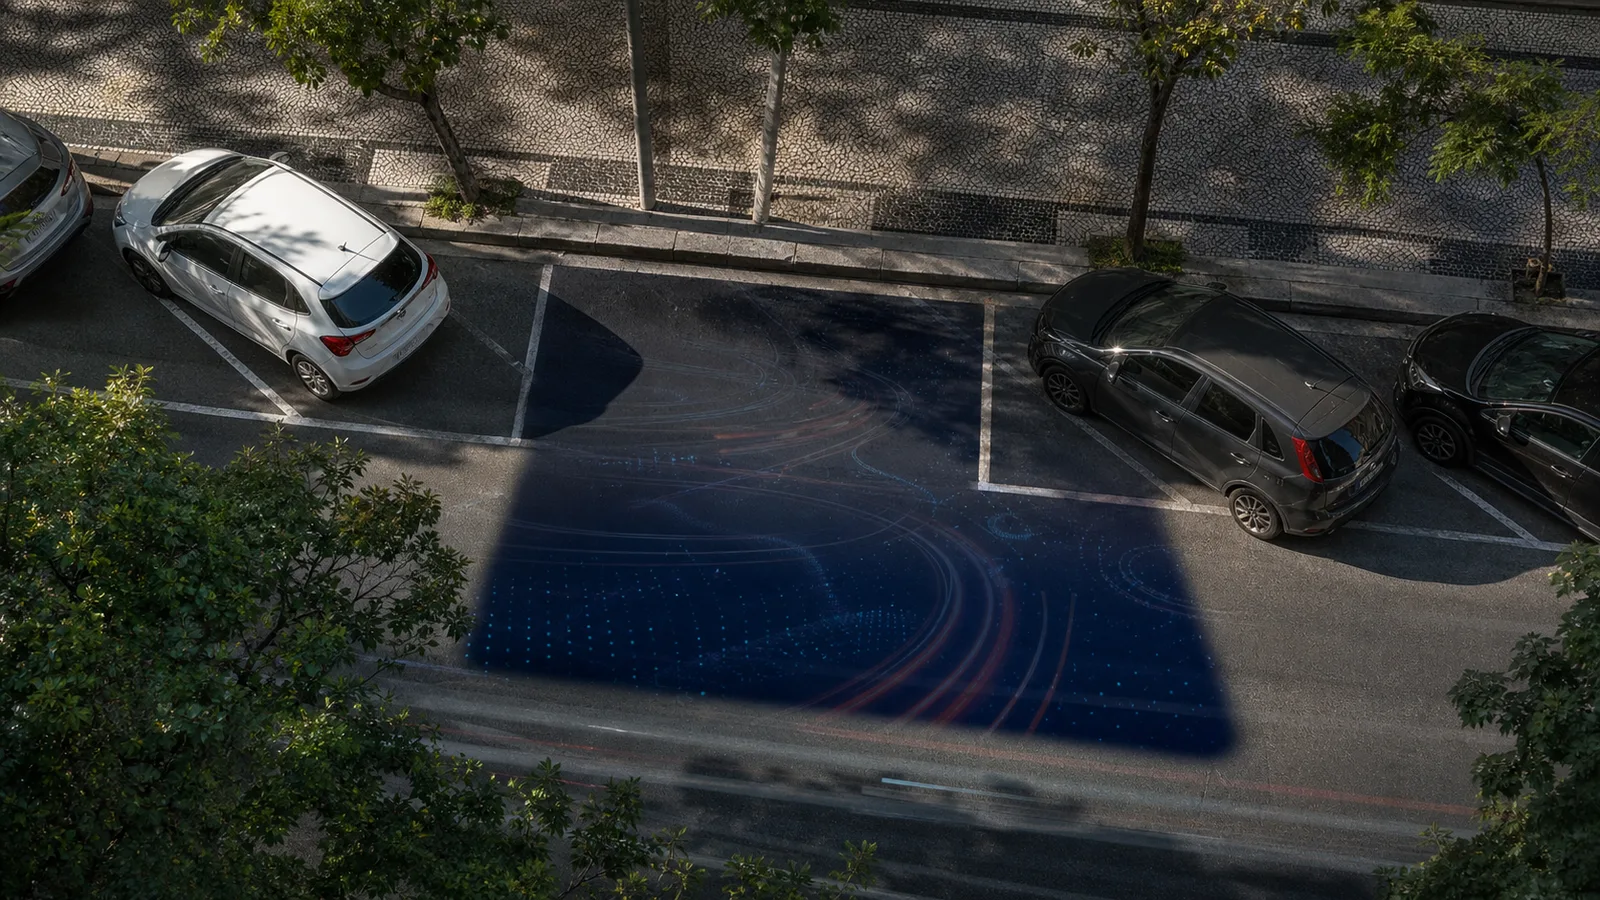
Watch the traffic in your city center on a Tuesday morning. Some of the cars around you are not going anywhere: they have already arrived. They are circling the block looking for a parking space. This traffic has a name in the urban mobility literature: cruising for parking. It does not appear as a budget line, but it adds travel time, fuel consumption, and emissions. Studies in different cities help explain the mechanism; its size in any given city must be measured locally.
A problem measured for nearly a century
Traffic engineers have been measuring cruising since 1927. A review by Robert Hampshire and Donald Shoup gathered 22 studies from 15 cities: the share of observed traffic searching for parking ranged from 8% to 74%, averaging 34%, with an average search time close to 8 minutes. The range matters as much as the mean: location, time, and collection method change the result.
Other surveys use different methods. IBM's self-reported survey heard 8,042 drivers in 20 cities: it recorded an average search close to 20 minutes, and nearly six in ten participants said they had abandoned a parking search at least once in the previous year. In the United States, an INRIX study estimated 17 hours per driver per year and a national cost of US$72.7 billion; for New York, it estimated 107 hours. A self-reported survey and an economic estimate are not the same as a traffic count.
None of these results measures a specific Brazilian city. They show that parking search can be material, not how much traffic it represents in Araras, São Paulo, or any other municipality. A local answer requires a defined area, counts of total traffic and searching vehicles, recorded time bands, and repeated observation on comparable days.
The cost that appears in no budget
Westwood Village shows how the estimate is built. In a 15-block commercial district in Los Angeles, Shoup measured an average search of 3.3 minutes and half a mile per vehicle. With 470 spaces and turnover of 17 vehicles per space per day, the study estimated 950,000 additional miles, 47,000 gallons of fuel, and 730 tons of CO₂ in one year.
Those values cannot be multiplied directly by the number of blocks in a Brazilian city. Parking supply, turnover, speed, fleet, and street design change the calculation. The method can be reapplied: measure search time and distance, relate the result to observed turnover, and document the factors used to convert travel into fuel, emissions, and cost. Without that baseline, local impact is a hypothesis, not a result.
Noise is another measurable variable. The World Health Organization recommends reducing average road-traffic-noise exposure below 53 dB Lden, an indicator that combines day, evening, and night; it is not an instantaneous sidewalk reading. The European Environment Agency places transport noise among Europe's three leading environmental health threats, behind air pollution and temperature-related factors. Without local acoustic measurements, it is not possible to say that a corridor exceeds this value or quantify how much a parking policy would reduce it.
Two mechanisms that increase parking search
Price, occupancy, and information help explain why parking search grows in certain places. They do not exhaust the problem, but they offer variables a city can observe and test.
The first mechanism is persistent occupancy. When nearly every space remains occupied, a driver who insists on parking in that segment must wait for someone to leave. Shoup proposes occupancy around 85% as an operating reference to keep one or two spaces available per block. It is not a universal threshold: SFpark used a target range of 60% to 80%, and each project must consider block size, accessibility, loading, time bands, and local demand.
The second is a lack of operational information. Without a space inventory and time series by segment and time band, the manager cannot distinguish concentrated demand from an unsuitable rule, an enforcement gap, or an activation channel that is hard to access. Updated data can inform supply, price, and maximum stay, but the decision remains a matter of public policy and must reflect local conditions.
What SFpark measured
SFpark combined availability information, payment, time limits, and demand-responsive pricing in seven San Francisco pilot areas. The SFMTA evaluation compared those areas with control areas: it recorded an average reduction of 5 minutes, or 43%, in search time and a 30% decrease in vehicle miles and emissions associated with cars searching for parking. The average on-street meter rate fell by US$0.11 per hour, or 4%. These are results of the pilot and its evaluation design, not a transferable promise for another city.
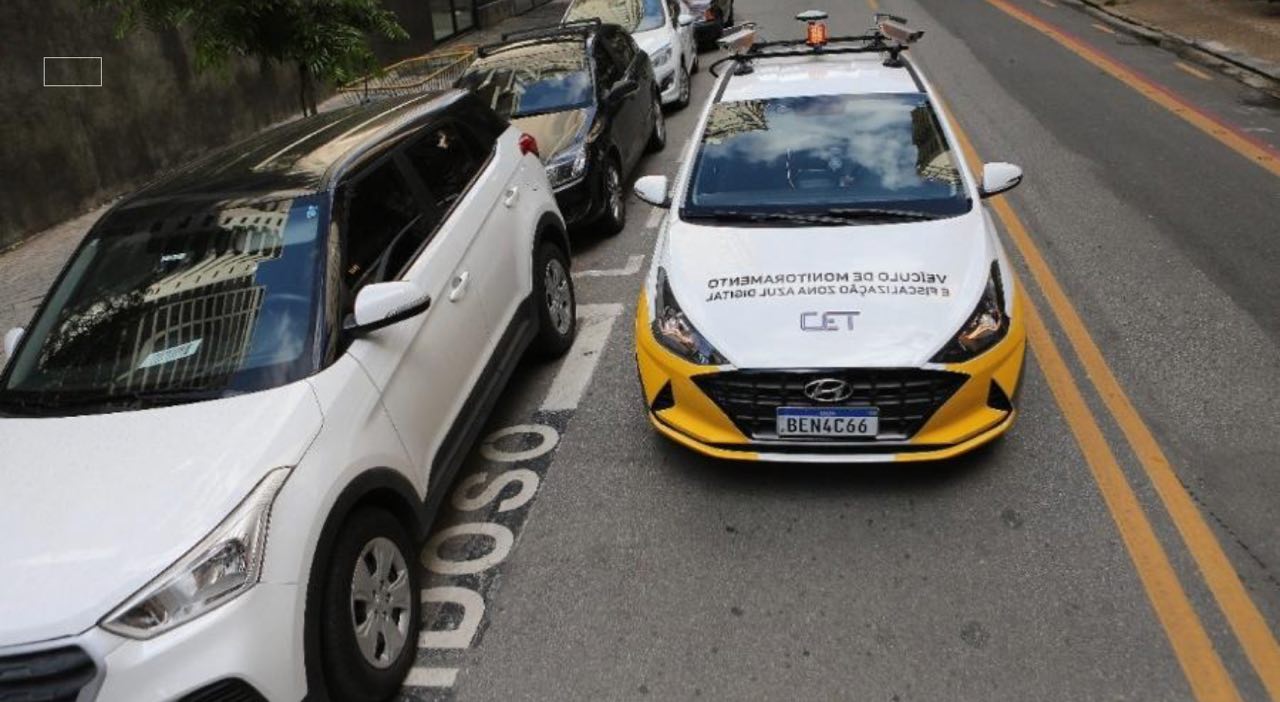
Sensors, digital channels, mobile ALPR capture, and management platforms can support a similar policy, but no tool on its own replicates SFpark. The project needs a baseline, an explicit rule, channel-coverage testing, and comparison between equivalent periods. Without that, a dashboard shows activity, not effect.
What this means for a Brazilian project
In Brazil, Zona Azul is a municipal instrument for managing parking turnover. Its digital operation can bring together activation channels, inventory, rules, enforcement, and indicators. An app serves drivers only where it is accredited; ALPR produces readings for review, not automatic citations; and occupancy can be stated only when a source and measurement method are defined. Any reduction in search, emissions, or cost must be demonstrated before and after in the municipality itself.
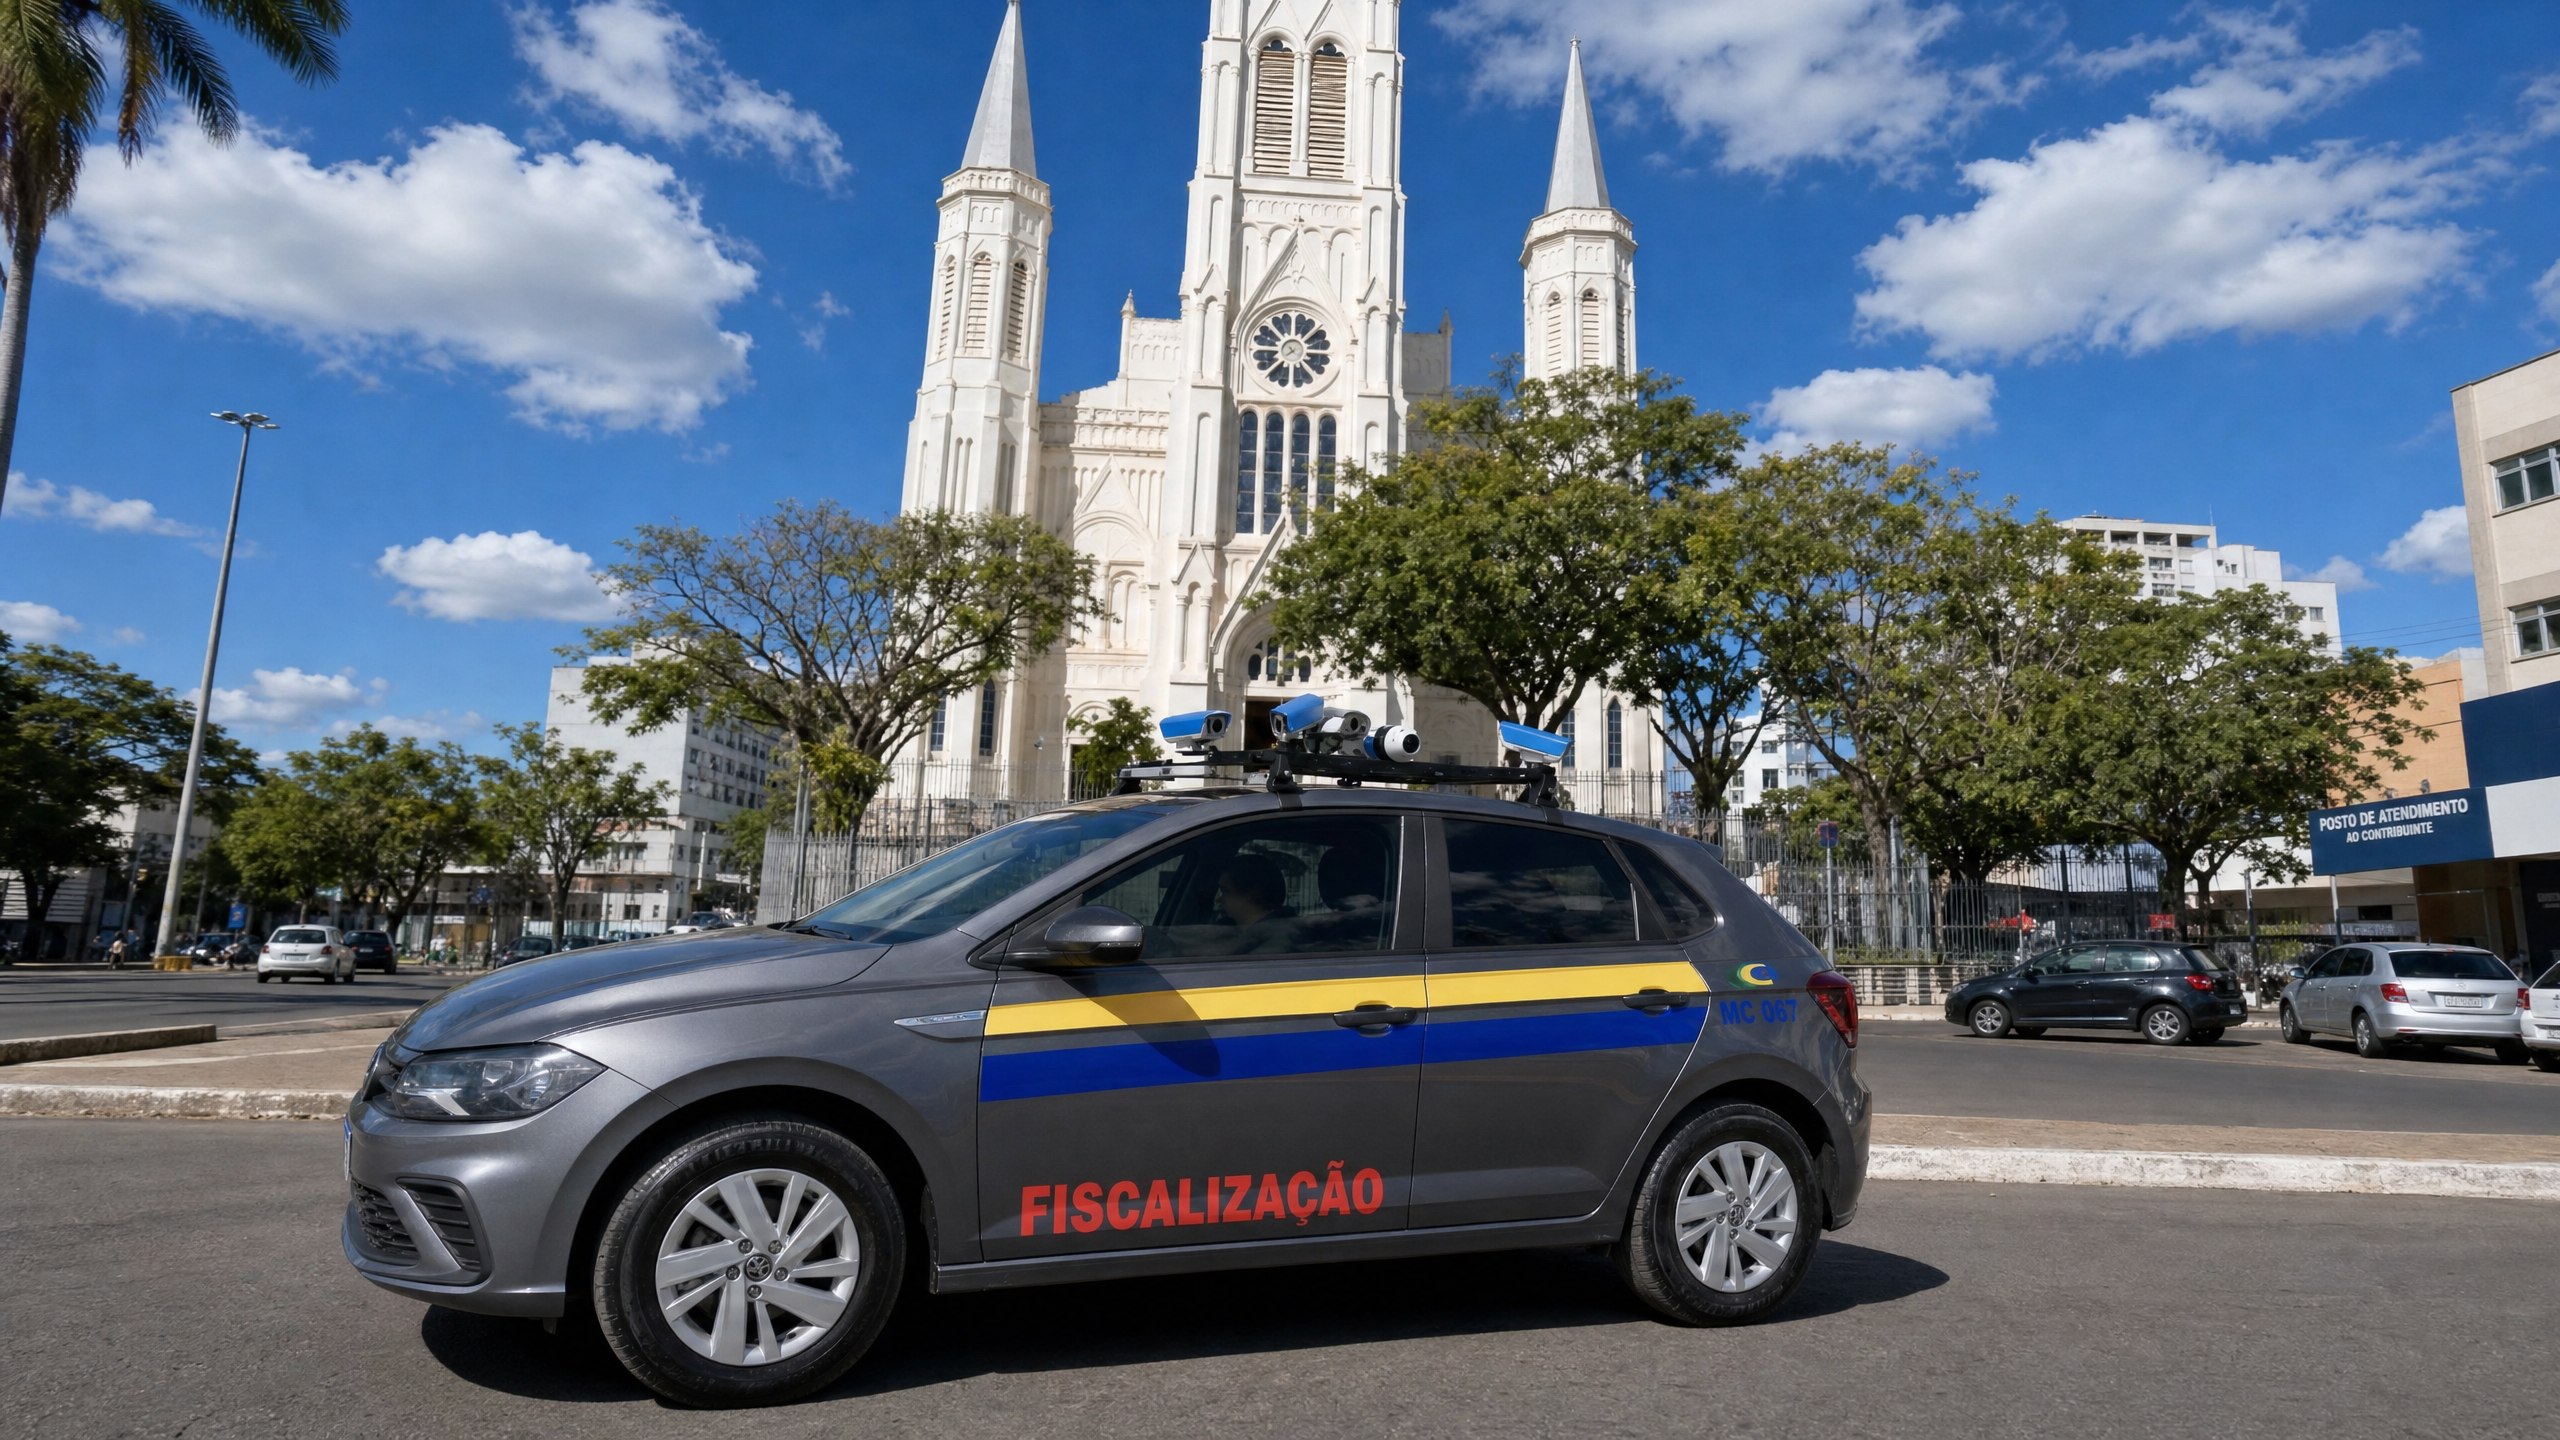
In this architecture, Olho Vivo® Parking organizes the inventory, rules, activations, reconciliation, and operational indicators. Digipare is a citizen channel where it is accredited. Olho Vivo Patrol supports mobile ALPR capture, and AreaDetect sensors can measure presence in the spaces where they are installed. Each city's scope defines which components exist and which indicators can be calculated.
Turnover is mobility policy and climate policy
Paid street parking should not be evaluated only by revenue. A well-designed policy can reduce persistent occupancy and make it easier to find a space, but the result depends on the rule, supply, enforcement, communication, and behavior. Curb space is a contested public resource; managing it with data allows the city to verify whether the policy delivers the intended turnover.
If the city does not yet measure parking search, the first step is to define a baseline and comparison method. Review the municipal cases with visible sources, see the criteria for evaluating a paid-parking platform, and, to discuss the project's setting, talk to Areatec's team.
FAQ: cruising, occupancy rate and digital street parking
What is cruising for parking?
It is the circulation of vehicles that have already reached their destination and continue driving only to find a space. In the 22 studies gathered by Hampshire and Shoup, that search accounted for 34% of traffic on average in the areas and time bands studied; it is not a universal average.
Is there one ideal occupancy rate for every city?
No. About 85% is a reference proposed by Shoup to keep one or two spaces available per block; SFpark used a 60% to 80% target range. The local target should reflect street design, special uses, time bands, and demand.
Does digital paid street parking automatically reduce search traffic?
No. Activation channels, enforcement, and data help execute and measure the policy, but the effect depends on local rules and operations. In SFpark, a specific set of measures reduced average search time by 43% and cruising mileage by 30% in the pilot areas.
References
- Hampshire, R.; Shoup, D. How Much Traffic is Cruising for Parking? (Transfers Magazine, 2019)
- Shoup, D. Cruising for Parking (ACCESS Magazine, 2007)
- INRIX. Parking Pain in the U.S. (2017)
- IBM. Global Parking Survey (2011)
- SFMTA. SFpark Evaluation Shows Parking Easier, Cheaper in Pilot Areas (2014)
- WHO (Europe). Environmental Noise Guidelines for the European Region (2018)
- European Environment Agency. Environmental Noise in Europe (2025)